This is labeled as a pie chart. A pie chart can be used in many different ways. this is one example of how graphics can help students understand the way Bloom's taxonomy works.
This is called a mind map. It can be somewhat confusing for some students, but is also a great way to get students thinking and seeing the flow of things throughout Bloom's Taxonomy.
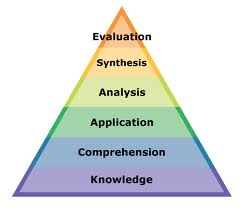
Here is another example of the way graphics can be incorporated into introducing Bloom's taxonomy. This pyramid chart lists the sequence of Bloom's Taxonomy very simply.
Lastly, this is the table map. This would also help those students that learn from graphics understand where Bloom is coming from. It is a little more organized and well thought out compared to the other charts and tables.


No comments:
Post a Comment